PART II: CHART PATTERNS
11. CHANNEL
Introduction:
A closely associated concept to the trend line is the channel or return line. The trend line is a primary tool of technical analysis and the channel line, a secondary one.
What is a Channel?
Channel is a continuation pattern that slopes up or down and is bound by an upper and lower trend line. The upper trend line marks resistance and the lower trend line marks support. Price channels with negative slopes (down) are considered bearish and those with positive slopes (up) bullish. For explanatory purposes, a "bullish price channel" will refer to a channel with positive slope and a "bearish price channel" to a channel with negative slope.
The Concept:
The channel line or return line represents the point at which reactions start against the current trend. The trend line and the channel line together define the area called the trend channel or simply the channel.
In an Uptrend, the high created at the return line is a form of resistance. In a downtrend, the low created at the return line is a form of support.
The failure to reach a channel line provides warning that the current trend is losing strength. If, on the other hand, a stock breaks out of the channel line, it is a sign the current trend is accelerating.
Channels – Classification:
1. Bullish Price Channel:
As long as prices advance and trade within the channel, the trend is considered bullish. The first warning of a trend change occurs when prices fall short of channel line resistance. A subsequent break below main trend line support would provide further indication of a trend change. A break above channel line resistance would be bullish and indicate an acceleration of the advance.
* To enlarge the chart Double click by keeping the cursor above the chart.
THERMAX
GOLD
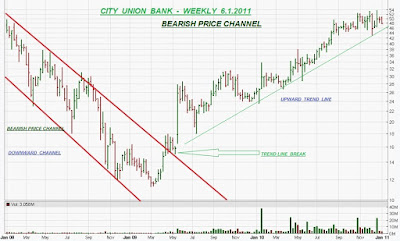
2. Bearish Price Channel:
As long as prices decline and trade within the channel, the trend is considered bearish. The first warning of a trend change occurs when prices fail to reach channel line support. A subsequent break above main trend line resistance would provide further indication of a trend change. A break below channel line support would be bearish and indicate an acceleration of the decline.
BEARISH CHANNELS
PUNJ LLOYD
CITY UNION BANK
Note:
Trend lines seem to match reaction highs and lows best when semi-log scales are used.
Linear Regression Line and Channel:
Linear regression is a statistical tool used to predict the future from past data. It is used to determine the point at which prices are overextended.
Unlike Linear Regression trend line whose purpose is to show the equilibrium price, Linear Regression Channels are the indicators of possible price fluctuations from the trend line.
The Linear Regression Channel is created by drawing parallel lines above and below the Linear Regression trend line using two standard deviations.
Definition:
Linear Regression trend line:
A Linear Regression trend line is simply a trend line drawn between two points using the least squares fit method. The trend line is displayed in the exact middle of the prices. If you think of this trend line as the "equilibrium" price, any move above or below the trend line indicates overzealous buyers or sellers. The Linear Regression Line is mainly used to determine trend direction.
NIFTY – LINEAR REGRESSION CHANNEL
Linear Regression Channel:
A useful technical analysis charting indicator that uses a Linear Regression Line is the Linear Regression Channel which gives more objective buy and sell signals based on price volatility.
By drawing two parallel lines over and under the Linear Regression line we obtain a 100% Linear Regression Channel.
A Linear Regression Channel consists of three parts:
1. Linear Regression Line: A line that best fits all the data points of interest.
2. Upper Channel Line: A line that runs parallel to the Linear Regression Line and is usually one to two standard deviations above the Linear Regression Line.
3. Lower Channel Line: This line runs parallel to the Linear Regression Line and is usually one to two standard deviations below the Linear Regression Line.
Regression channel is a channel for price fluctuations; the top border line shows resistance whereas the bottom channel line shows support. The linear regression channel is a tool that is used to help predict the various future values of the stock while comparing it with its past values.
Note:
Price values can fall out of the channel for a while but if the price stays out of the channel for a prolonged period of time, the trend may reverse.
How to Use:
When using this method, the top channel line provides resistance while the bottom line provides support. Although prices may extend outside this channel, it is usually only for a relatively short period of time. If prices stay outside the channel, then it is possible that a reversal in trend might occur. The linear regression channel shows the range of the various prices that are to be expected in comparison to the trend line.
Traders usually view the Linear Regression Line as the fair value price for the future, stock, or forex- currency pair. When prices deviate above or below, traders expect prices to go back towards the Linear Regression Line.
As a consequence, when prices are below the Linear Regression Line, this could be viewed as a good time to buy, and when prices are above the Linear Regression Line, a trader might sell.
Conclusion:
A channel line is a secondary tool to the trend line. When drawn properly, it can benefit the trader in identifying support or resistance. It can also help you gauge whether the trend is losing steam or accelerating. You have to check other technical indicators which would be used to confirm these inexact buy and sell signals.
Dr.Felisleo
16.1.2011


